Using the Matplotlib and/or Seaborn Libraries
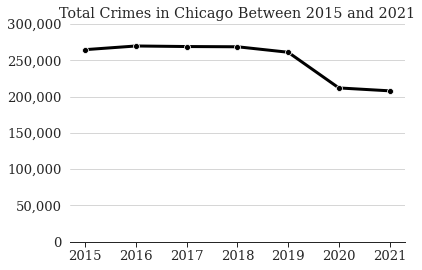
Line Chart
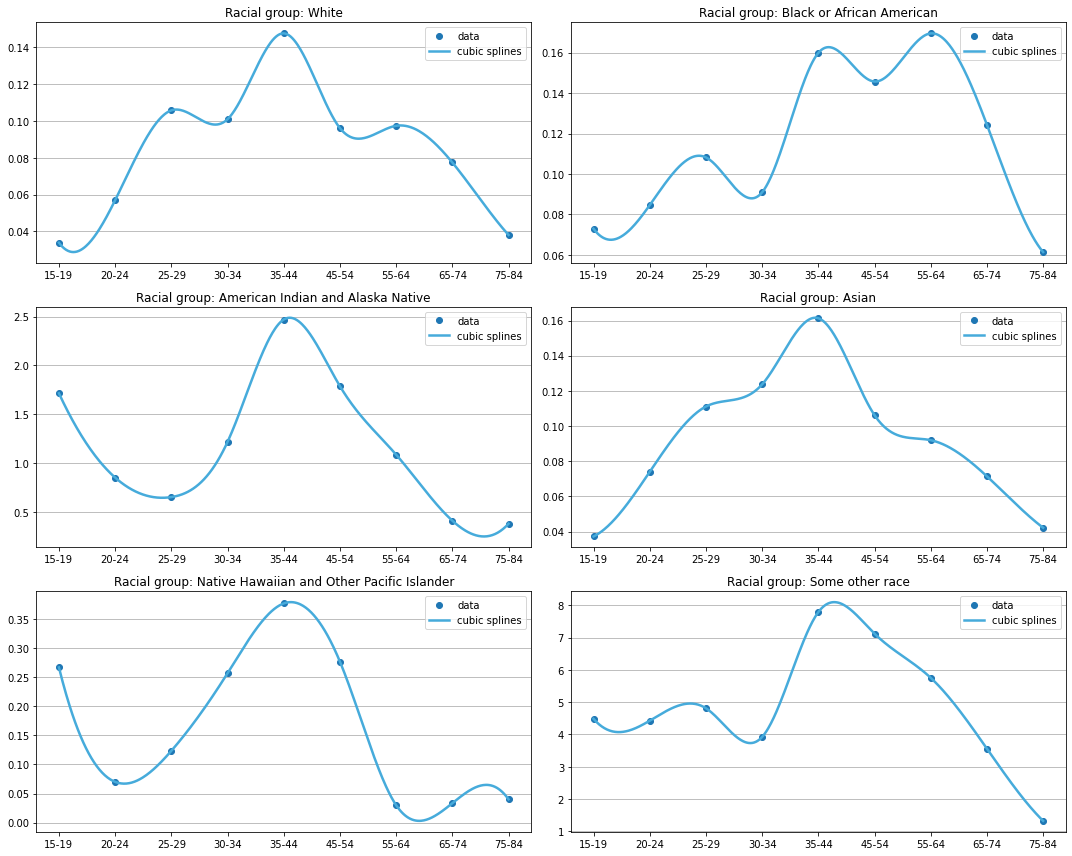
Scatter Plot
Scatter plots with splines (a spline is a smoothed line that connects all dots together):
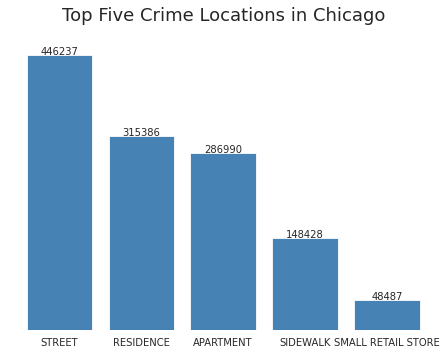
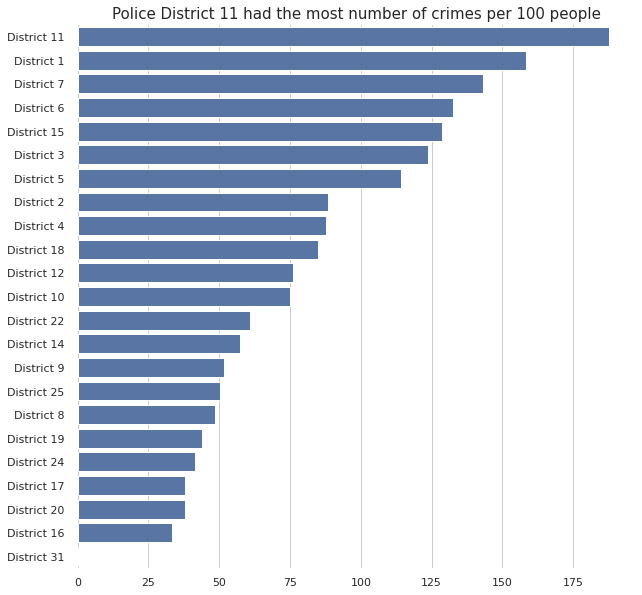
Bar Chart
Using the Altair Library
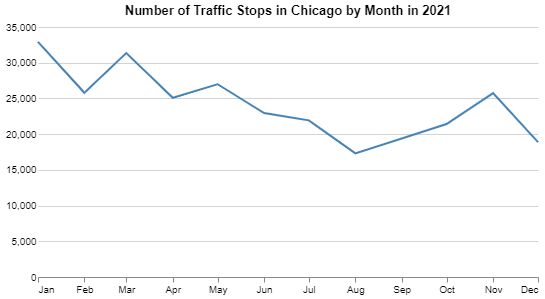
Line Chart
Bar Chart
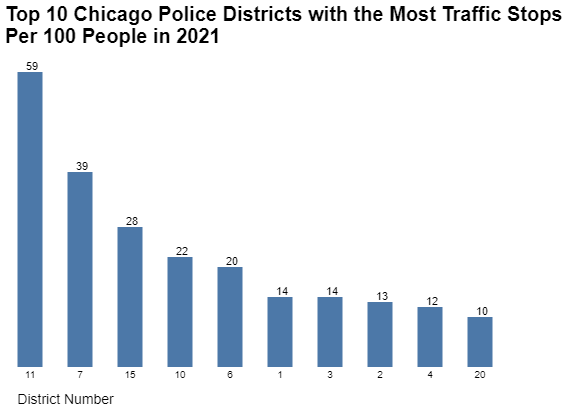
Vertical Bar Chart
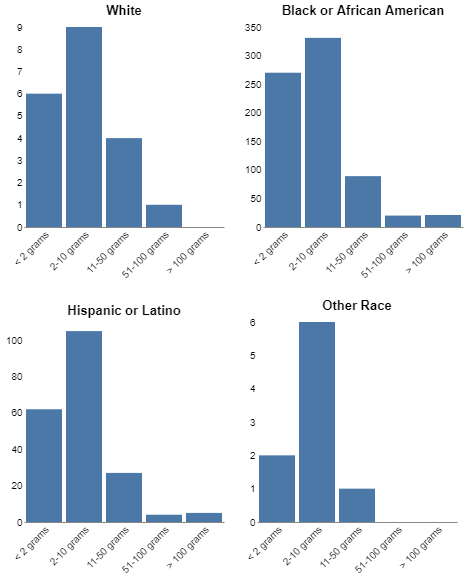
Faceted Bar Chart
Grouped Bar Chart
Stacked Bar Chart
Layered Bar Chart
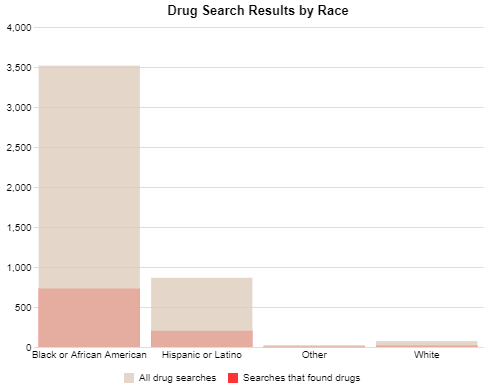
A layered bar chart is a special type of stacked bar charts, where y represents the cumulative value.That is to say, in a layered bar chart, each legend group is a layer and different layers collapse on each other instead of being put on top of each other.
Lollipop Chart
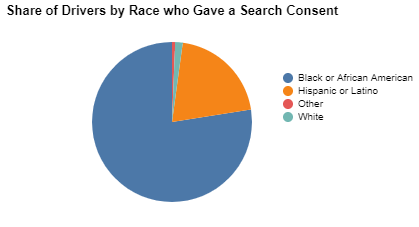
Pie Chart
